Diversity, Equity, and Inclusion (DEI) are becoming increasingly important in today's business world. As the…
The Problem
First, I want to define ConOps for those readers unfamiliar with the term:
Concept of operations (ConOps) is a document or graphic that communicates the characteristics of a proposed system from the stakeholder’s perspective (those who will use the system). ConOps can be a combination of quantitative and qualitative system characteristics. ConOps show how a set of capabilities may be employed to achieve desired objectives or an end state.(1)
Most ConOps solutions are complex, multidimensional and multivariable. Frequently, ConOps explanations are requested for Government proposal submissions. With such a multifaceted topic, how do you explain your ConOps in a way that your audience (evaluator) understands?
There are two reasons why most ConOps explanations fail.
- Familiarity. The subject matter experts (SMEs) that develop the concept of operations are intimately aware of the proposed ConOps details. When sharing ConOps information, SMEs either provide too much or too little information, because they make assumptions about the audience’s (evaluator’s) understanding of the content.
- Writing. Explaining ConOps in person is challenging. Explaining ConOps in an easy-to-understand written document is almost impossible. To successfully explain the ConOps textually, the reader must be 100% immersed in the document, and the writing must be clear, concise, professional, and audience-focused. That’s a problem. Readers are often distracted, and most documents are not professionally written (i.e., written by an experienced, trained writer).
The Solution
Follow these three steps to clearly explain your ConOps in a way that will help you succeed where others fail.
Step 1
Simplify. Why? Because your audience is not an expert with your ConOps. Explain it in a way that the reader understands. Your ConOps document wasn’t created for you and your team to read; it’s intended for your audience.
Do not include content, acronyms, and abbreviations that may confuse your audience. Keep it simple and clearly identify any benefits, outcomes, and discriminators (things that set your solution apart from your competition).
Step 2
Use a graphic. Why? Because when done right, graphics are easier to understand and remember than text alone. Additionally, graphics uncover omitted parts. For example, missing a step in a process is obvious when shown in a process diagram but might be overlooked on a page of text.
ConOps graphics are often a combination of multiple graphic types. The audience, content and message drive graphic type selection. however, most ConOps graphics fall into three graphic categories:
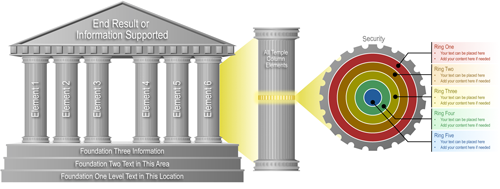
A. Graphic types that show how parts relate to the whole process or system. Use this approach as a roadmap throughout your document. Highlight each element and explain each in greater detail at the beginning of relevant sections throughout your document (see the temple graphic below). The following are two examples of graphics that show parts relating to a whole:
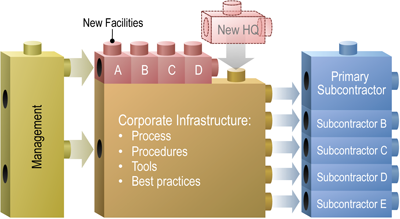
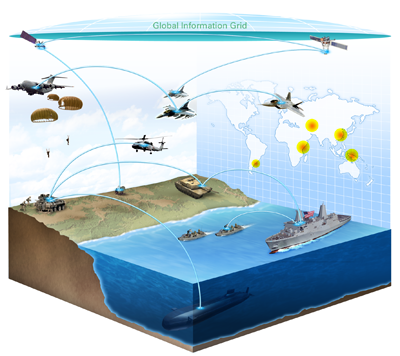
B. Graphic types that literally show the system in use. These graphics use photographs, drawings, schematics, floorplans, models, and other visuals that remain true to reality to depict your ConOps. The following two examples illustrate how each system functions in a real-world scenario:
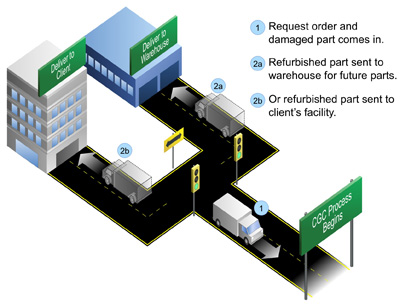
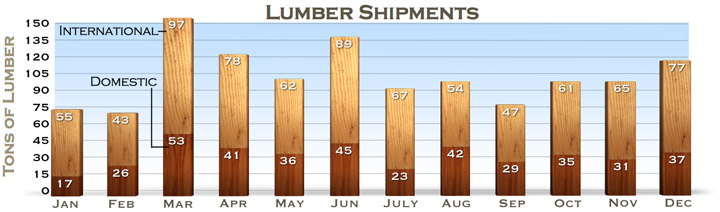
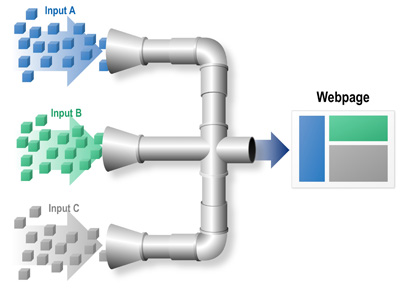
C. Graphic types that show process. Show how your system combines data, structures workflow, allows for continual improvement, manages risk, or offers a unique process flow using these graphic types. The following graphics illustrate the process through which the final outcome is reached:

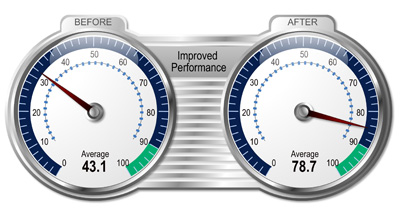
Add other graphic types within your ConOps graphic as needed. For example, consider gauge graphics to show quantitative data (shown below).
Step 3
Validate your solution. Why? Because SMEs and authors often miss or miscommunicate part of the solution due to over familiarity.
Ask someone that is similar to your target audience to review and explain your ConOps graphic to you. Do they understand it well enough to articulate the presented solution? If so, you are on the right path. If not, use their feedback to improve your ConOps graphic.
The next time you need to share your ConOps, use these three steps to more clearly explain your solution.
(1) Summarized from Wikepedia (http://en.wikipedia.org/wiki/Concept_of_operations) and my own experience
Related Posts